이번 포스팅에서는 해당 데이터를 전처리한 과정을 소개합니다.
사용한 데이터는 kaggle의 e-commerce 데이터입니다.
* 전처리 전체 코드는 여기에서 확인하실 수 있습니다.
📃 데이터 전처리
내가 원하는 분석을 하기에 앞서 먼저 데이터를 가공해야 합니다.
이번 프로젝트의 목적이 "CLV 예측"이라는 점을 유념하면서, LTV 예측 결과가 편향되지 않도록 전처리를 하려고 합니다.
보통 전처리 과정에서 outlier 등을 확인하기 위해 boxplot을 그려보거나, 데이터의 전체적인 분포를 보기 위해 간단한 groupby나 그래프를 그리면서 제가 분석할 데이터와 좀 더 친숙해지는 것 같아요.
어떤 순서로 데이터를 전처리하는 게 좋을까요?
물론 데이터 by 데이터/ 사람 by 사람이겠지만, 저는 아래의 순서를 따라서 진행하는 편입니다.
아래의 절차는 100% 저의 머릿 속에서 나온 것은 아니고, 지난 2월에 러닝스푼즈에서 수강한 프로덕트 분석 강사님께서 알려주신 데이터 클렌징 팁을 정리한 것입니다!
0) 데이터 살펴보기
1) 결측치 처리하기
2) 중복 데이터 처리하기
3) 이상치 처리하기
보통 1~ 3의 과정은 데이터에 따라 순서가 뒤바뀌기도 하지만, 순서보다는 결측치, 중복 데이터, 이상치를 모두 확인해본 상태에서 분석에 들어간다는 게 중요한 것 같습니다.
컬럼별 정보
- InvoiceNo: Invoice number that consists 6 digits. If this code starts with letter 'c', it indicates a cancellation.
- StockCode: Product code that consists 5 digits.
- Description: Product name.
- Quantity: The quantities of each product per transaction.
- InvoiceDate: Represents the day and time when each transaction was generated.
- CustomerID: Customer number that consists 5 digits. Each customer has a unique customer ID.
- Country: Name of the country where each customer resides.
전처리 전)
전처리 전, df_base.info()를 실행한 결과는 다음과 같았습니다.
CustomerID, Description에서 결측치가 보이고, 일부 컬럼이 제가 원하지 않은 Dtype으로 되어있는 것이 보입니다.

📌 Description, CustomerID에 결측치 존재: CustomerID의 경우 분석에 사용할 것이므로 결측치를 처리해야 함
📌 CustomerID의 Dtype이 float: object로 type 변환해줘야 함
📌 InvoiceDate의 Dtype이 object: datetime으로 type 변환해줘야 함
이것저것 확인
추가로 이것저것 확인해봅니다. 각 컬럼의 고유값 개수 확인, 값 범위 확인 등을 진행합니다.
len(df_base['InvoiceNo'].unique().tolist()) # InvoiceNo가 primary key인가? -> Nope
quantity = df_base['Quantity'].tolist()

print(len(list(filter(lambda x: x < 0, quantity)))) # quantity < 0 인 경우
print(len(list(filter(lambda x: x > 0, quantity)))) # quantity > 0 인 경우
📌 cancel한 주문건수가 있어 Quantity < 0 인 경우가 존재함, 나중에 전처리해야 함
컬럼명을 snake_case로 변경하고 원하는 컬럼만 빼두기
추후 분석하기 쉽게 하기 위해 모든 컬럼을 snake_case로 변경합니다.
# 컬럼 이름 snake case 로 rename
%%time
df_base.rename(columns = {'InvoiceNo':'invoice_no',
                        'StockCode':'stock_code',
                        'Quantity': 'quantity',
                        'Description':'description',
                        'InvoiceDate': 'invoice_date',
                        'UnitPrice': 'unit_price',
                        'CustomerID': 'customer_id',
                        'Country':'country'}, inplace = True)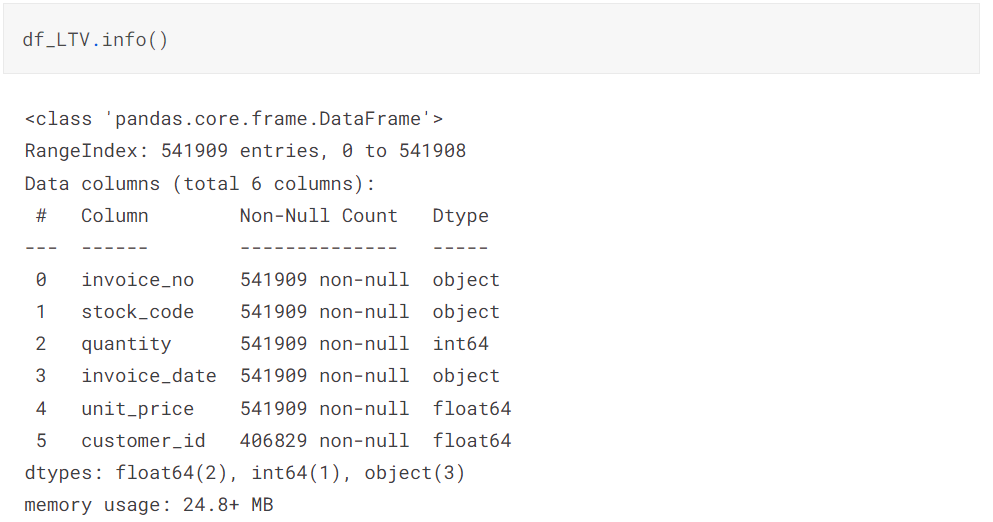
# LTV 계산에서 필요할 것 같은 컬럼만 빼두기
LTV_columns = ['invoice_no', 'stock_code', 'quantity', 'invoice_date', 'unit_price', 'customer_id']
df_LTV = df_base[LTV_columns]
본격적인 확인 및 전처리
1) 결측치 처리
customer_id:
- 결측값 = 비회원으로 추정
- 추후 LTV 계산에서 활용하지는 않을 것이지만 fillna(0)
# 전처리 다시 해야될 경우 대비해서 copy
df_LTV_01 = df_LTV.copy()

## customer_id type 변환해도될지 체크
list(filter(lambda x: str(x)[-1] != '0', df_LTV_01['customer_id'].unique().tolist()))
df_LTV_01['customer_id'].isna().sum() # customer_id 결측값 확인
df_LTV_01.sample(5) # 어떤 경우에 customer_id가 NaN인지 확인
df_LTV_01[df_LTV_01['invoice_no'] == '536865' ] # 비회원으로 추정, LTV 계산에서 활용 불가
## 결측값 모두 0으로 채우기
df_LTV_01['customer_id'] = df_LTV_01['customer_id'].fillna(0)

## type을 object로 바꾸기
df_LTV_01 = df_LTV_01.astype({'customer_id' : 'int'}) # float 였으므로 .0 없애기 위해 먼저 int로 변환
df_LTV_01 = df_LTV_01.astype({'customer_id' : 'object'})
df_LTV_01.info()
2) Invoice_date 처리
현재 type: object -> datetime으로 변경
df_LTV_01['invoice_date'] = pd.to_datetime(df_LTV_01['invoice_date'], format = '%m/%d/%Y %H:%M')

# date관련 데이터 추가하기: 월 정보
df_LTV_01['invoice_year'] = df_LTV_01['invoice_date'].dt.year
df_LTV_01['invoice_month'] = df_LTV_01['invoice_date'].dt.month
df_LTV_01['invoice_day'] = df_LTV_01['invoice_date'].dt.day

df_LTV_01.head()
3) 파악을 위한 시각화
이 프로젝트에서 시각화가 목적은 아니지만, 연습해볼 겸 이 노트의 코드를 활용해 그려보았습니다.
world map 그려보기
world_map = df_base[['customer_id', 'invoice_no', 'country']
              ].groupby(['customer_id', 'invoice_no', 'country']
                       ).count().reset_index()

countries = world_map['country'].value_counts()

data = dict(type='choropleth',
            locations = countries.index,
            locationmode = 'country names',
            z = countries,
            text = countries.index,
            colorbar = {'title':'Orders'},
            colorscale='Viridis',
            reversescale = False)

layout = dict(title={'text': "Number of Orders by Countries",
                     'y':0.9,
                     'x':0.5,
                     'xanchor': 'center',
                     'yanchor': 'top'},
              geo = dict(resolution = 50,
                         showocean = True,
                         oceancolor = "LightBlue",
                         showland = True,
                         landcolor = "whitesmoke",
                         showframe = True),
             template = 'plotly_white',
             height = 600,
             width = 1000)

choromap = go.Figure(data = [data], layout = layout)
iplot(choromap, validate = False)
컬럼별 이상치 및 값 범위 확인
def desc_stats(dataframe):
    desc_df = pd.DataFrame(index= dataframe.columns,
                           columns= dataframe.describe().T.columns,
                           data= dataframe.describe().T)

    f,ax = plt.subplots(figsize=(10,
                                 desc_df.shape[0] * 0.81))
    sns.heatmap(desc_df,
                annot = True,
                cmap = "Greens",
                fmt = '.2f',
                ax = ax,
                linecolor = 'white',
                linewidths = 1.1,
                cbar = False,
                annot_kws = {"size": 12})
    plt.xticks(size = 18)
    plt.yticks(size = 14,
               rotation = 0)
    plt.title("Descriptive Statistics", size = 14)
    plt.show()

desc_stats(df_LTV_01.select_dtypes(include = [float, int]))
📌취소된 주문내역 때문에 quantity(unit_price) < 0인 row 존재
📌 total_price = quantity * unit_price로 구할 예정
quantity, unit_price에 대한 전처리는 다음 포스팅에서 이어서 하도록 하겠습니닷
혹시 이전 포스팅이 궁금하시다면
[개인프로젝트] 고객 LTV(Life Time Value) 예측 - 목표 및 계획
프로젝트 목적: e-commerce 데이터를 이용한 인사이트 도출 연습 및 공부 프로젝트 목표 고객이 다음에 얼마를 구매할지 예측할 수 있을까? LifeTime Value(LTV)는 현재 유저들의 미래 가치를 예측하여
youngfromkorea.tistory.com
참고자료
'데이터 분석 > 프로젝트' 카테고리의 다른 글
| [클론 프로젝트] 타이타닉 시각화/랜덤포레스트로 생존 여부 예측하기 (0) | 2023.06.30 |
|---|---|
| [개인프로젝트] CLV(Customer Lifetime Value) 예측 - 최종 전처리 (0) | 2023.05.10 |
| [개인프로젝트] CLV(Customer Lifetime Value) 예측 - 목표 및 계획 (2) | 2023.04.19 |